 AI Operating Map
See what AI is actually delivering, not just what it costs.
Most orgs can say roughly what they're spending on AI tools. Far fewer can say what it's actually achieving. AI Operating Map tracks use cases from idea to live deployment and logs what AI is costing by person and tool, self-reported by your team, not connected to your billing systems, so you can see value and cost side by side.
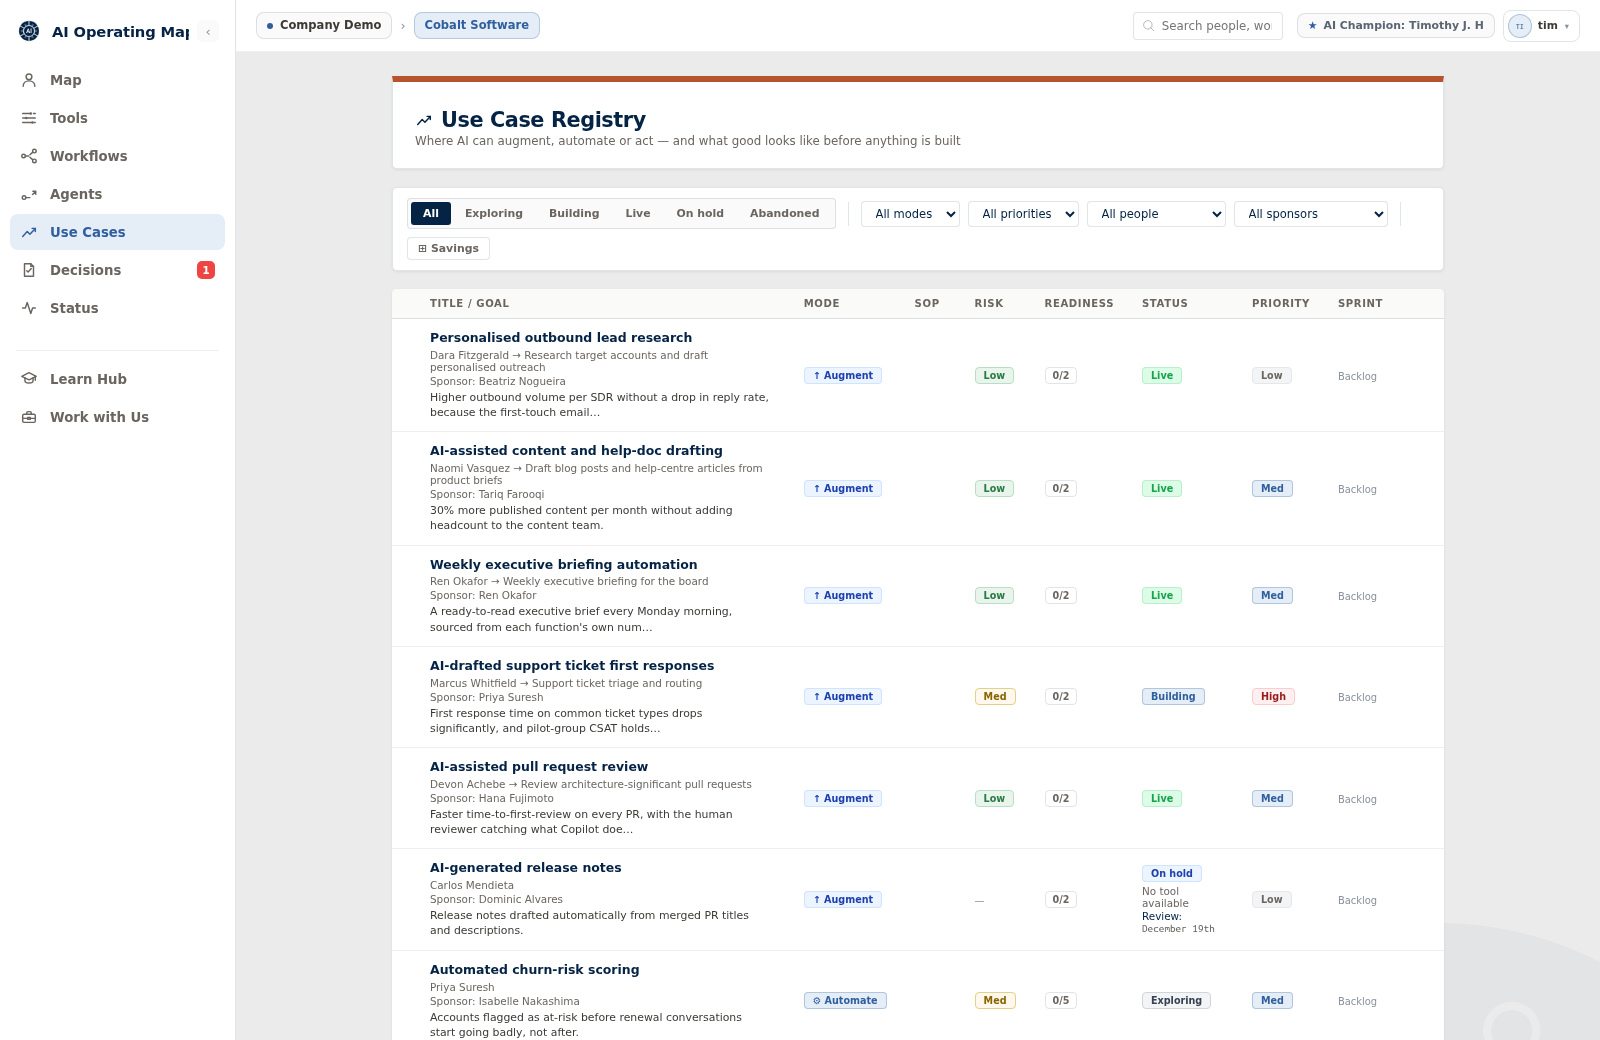
Outcomes & Value tracker — real product screenshot, org name anonymised.
What the tracker captures
Four things, kept current as a use case moves from idea to live.
Do you know what AI is actually costing you this month, by tool and by person, or just a vague sense of the total, and can you say which use cases have earned their keep versus which are still just an idea?
If not, that's exactly the gap Outcomes & Value closes — not eventually, the next time someone asks.
Put a number next to what AI is actually doing
Fifteen minutes to see how Outcomes & Value fits your reporting.
See pricing